BPM
Part 1: Team Block Diagram
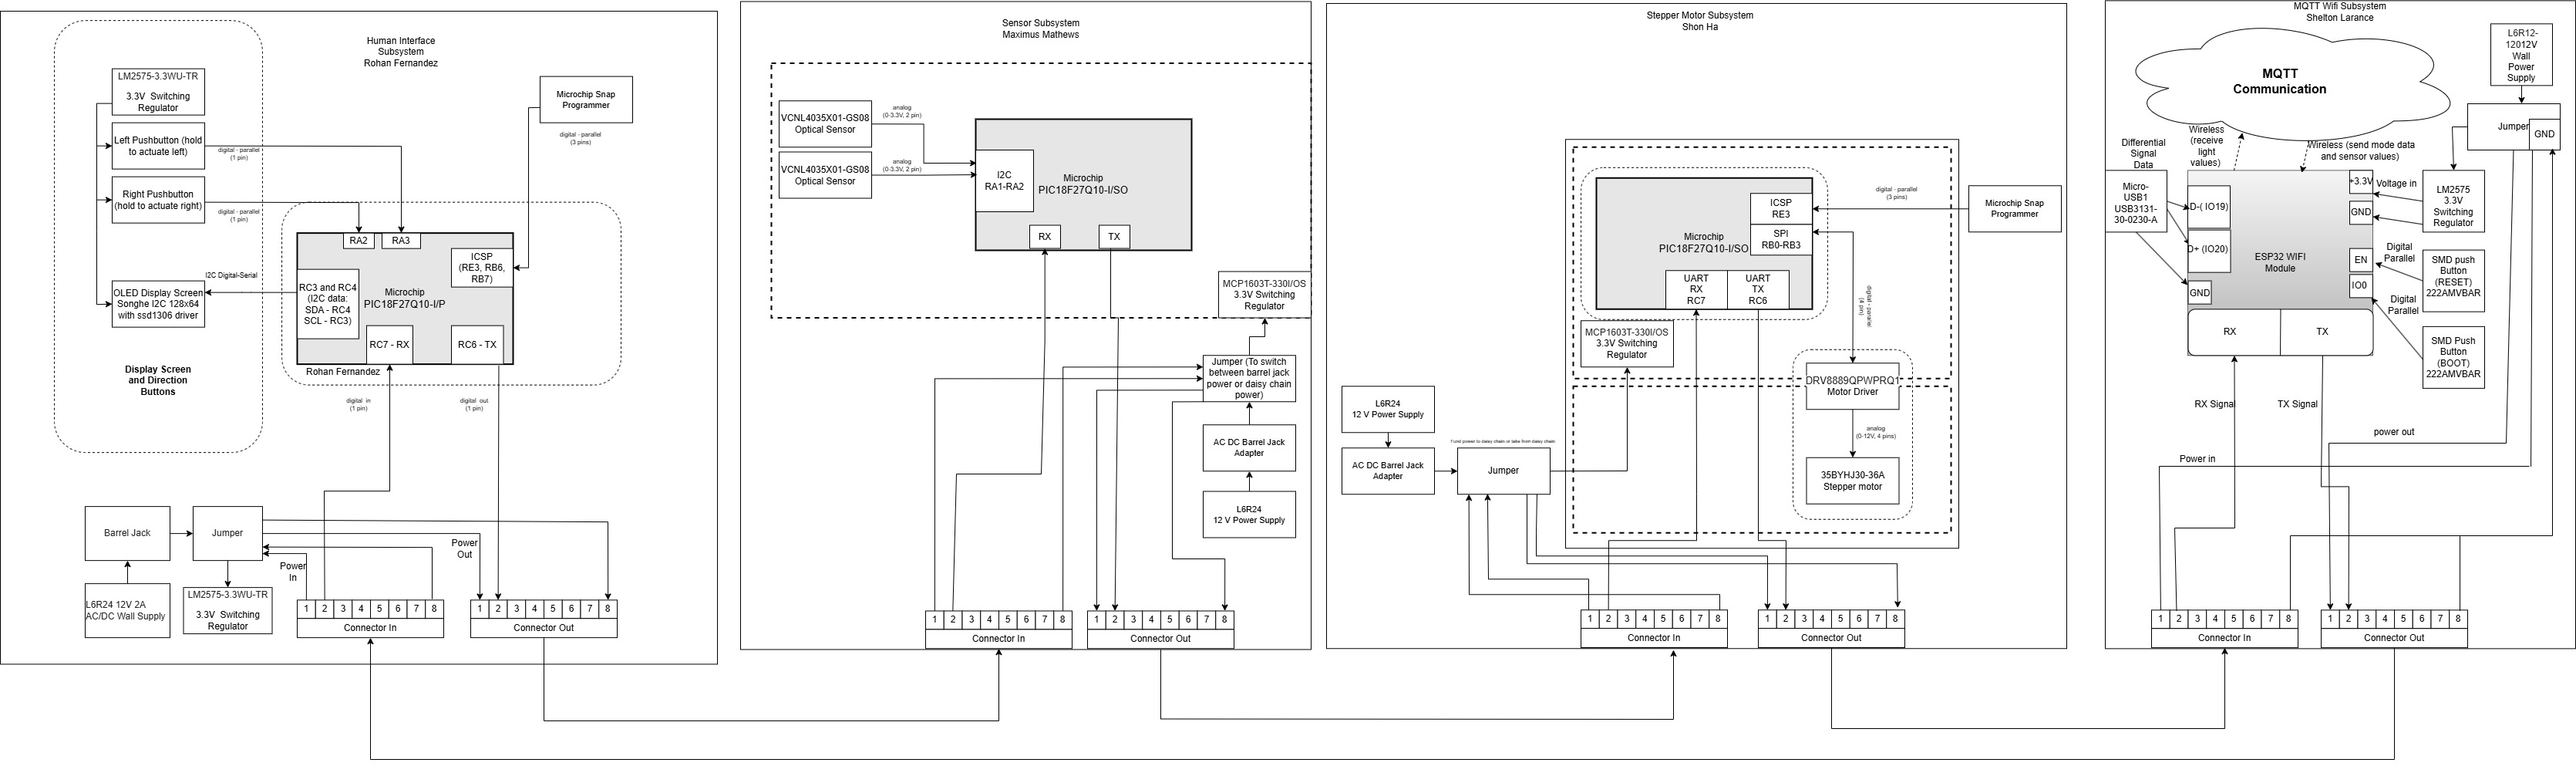
Click on image to enlarge
Part 2: Sequence Diagram

Part 3: Message Types
| Byte | Function |
|---|---|
| AZ | Start |
| YB | Stop |
| Team Members | Team IDs |
|---|---|
| Shon Ha | h |
| Maximus Mathews | m |
| Shelton Larance | l |
| Rohan Fernandez | f |
| Broadcast | X |
| Message Type | Description |
|---|---|
| 1. Wifi Toggle - Auto/Manual | 1 byte for toggling between Auto and Manual mode |
| 2. Light Level | 24 Bytes (6 for each sensor with 2 as identifier and 4 as readings) |
| 3. Button - Digital Signal | 2 bytes for 2 buttons to control stepper motor |
| Message Type 1 Definitions | |
|---|---|
| Bytes 1 (char) | Mode (M) |
| Bytes 2 (char) | Automatic or Manual - "0" or "1" |
| Message Type 2 Definitions | |
|---|---|
| Bytes 3-4 (char) | Light Level with a space - "L" |
| Bytes 5-8 (char) | Light Level Reading - "XXXX" |
| Message Type 3 Definitions | |
|---|---|
| Bytes 32 (char) | button left (L) |
| Bytes 33 (char) | byte to control motor turning left |
| Bytes 34 (char) | button right (R) |
| Bytes 35 (char) | byte to control motor turning right |
| Message Type | Message ID Type: Char | Rohan HMI ID: f | Maximus Sensor ID: m | Shon Motor ID: h | Shelton MQTT ID: l |
|---|---|---|---|---|---|
| Mode Toggle | M | R (activates button toggle to control motor) | - | R (Sets motor into manual control using buttons) | S (mqtt topic: /EGR314/TEAM311/Mode) |
| Light Levels | S1 & S2 | R (recieves and displays light level to screen) | S (sends light data to motor) | R (using data, turns motor in direction with highest light level) | R (mqtt topic: /EGR314/TEAM311/LightLevels) |
| Button-Digital Signal | L & R | S (button control if in manual) | - | R (manual control using buttons) | - |
Feedback Implementation
We encountered many issues with our BPM, where we implemented several changes that helped improve the understandability of the diagram. Our block diagram had several items missing that were promptly included and fixed. Furthermore, the size was adjusted to make it more readable. The sequence diagram was changed to better reflect the structure of the assignment and for more clarity on our system. The message structure was modified to streamline our communication through UART and the daisy chain. This helped set a benchmark for messages that were viable.
Block Diagram Decision Process
We structured our block diagram to reflect our sequence diagram and help give an idea of how the subsystems would function and transmit data when connected together. We realized to reduce lag and improve the speed of the subsystem overall, we placed the sensor system before the motor system. This allowed for the motor to immediately receive the light levels from the sensor system. This block diagram meets our product requirements as it incorporates several systems that help showcase STEAM-based innovation, where it demonstrates, to students from K through 12, solar power while incorporating a more advanced system of communication throughout our boards.
Functionality of Sequence Diagram
Our sequence diagram showcases the several features that we currently have implemented in our system. Firstly, we start with the user interface, which communicates with the sensor system and sends the data regarding automatic/manual mode and the state of the two buttons. Furthermore, it displays the sensor values on an OLED screen. Next, the sensor system takes the data received from the user interface system and adds the sensor values to the data, then sends it to the motor system. The motor system decides which data to use, based on automatic or manual mode. If in automatic, it will use the sensor values. Otherwise, it will use the button states to determine the direction of movement. Finally, the MQTT system showcases the values on the Wi-Fi module and toggles between automatic and manual mode. These functions satisfy our product requirements, as they effectively make an automated solar panel that demonstrates solar energy and serial communication.
Message Structure Decision Process
We structured the message to incorporate an order for our data to help streamline the reading of our data from our individual subsystems. We start with the mode data, which helps determine the current mode for the system. Since the mode data is first in the data string, it immediately lets the motor system know what to look for. This helps decrease the lag in the system and optimize the system more. Next, we have the data from the two sensors, which is placed directly after the mode data. Since the system will start in automatic mode and will stay in automatic mode for the most part, the data for the sensors should be placed relatively to the front of the message, and the data for the buttons would be ignored, decreasing the overall lag of the system. Finally, we have the button data at the end of the message. Since the system will rarely be in manual mode, the button data is passed on last, and this will help streamline the process of looping through the daisy chain.
Top 5 Changes in Software
-
The team had to reduce the amount of sensors from 5 to 2, where two optical and the voltage sensor were removed from the project completely. With this required changing the structure of the code to accomodate for a different I2C address as initially everything went through a multiplexer.
-
The team had to change the structure of the I2C communication for the HMI as the team decided to switch from an LCD to an OLED due to hardware complications. This required changing the I2C address along with the functions used for the OLED.
-
The API was restructured to accomodate for strings of characters rather than utilizing uint8 variables. This made it easier for teammates to decipher the strings of information being sent over UART as there was complications with the API previously while utilizing uint8 variables.
-
The team had to change the value at which the sensors read from 65535 to 9999 to accomodate for how the API was structured. If this change was not made, it would create complications with the API structure, making it impossible for the motor to read sensor data.
-
Due to exclusion of the voltage sensor, the code for the HMI and MQTT had to be changed to display light levels coming from the two optical sensors as their was no voltage sensor. This was done to meet product requirements and also show functionality on how the team;s individual subsystems communicate entirely